Troubleshooting & Field Repairs
Develop the mindset to diagnose failures: skirt leaks, vibrations, steering issues, power loss. Learn quick repairs and jury-rigging under competition time pressure.
📖 Overview
Develop the mindset to diagnose failures: skirt leaks, vibrations, steering issues, power loss. Learn quick repairs and jury-rigging under competition time pressure.
📚 Study Guide
9.1 Engineering Design Process
The Iterative Loop: Design, Build, Test, Analyze, Redesign
The Engineering Design Process (EDP) is not a checklist — it is a feedback-driven cycle that professional engineers and top Science Olympiad teams treat as their core methodology. Understanding why the loop exists, and how to execute it rigorously, is the difference between a team that improves systematically and one that guesses and hopes.
The classical loop has five phases:
- Design — Propose a configuration based on physics principles and prior data.
- Build — Construct the vehicle to spec, noting any fabrication deviations.
- Test — Run the vehicle under controlled, documented conditions.
- Analyze — Interpret results against predictions; identify what matched and what didn't.
- Redesign — Formulate a specific hypothesis and modify the design accordingly.
Then the loop repeats. The key word is loop — not a straight line from concept to competition. Teams that treat the EDP as a checklist ("we built it, we tested it once, we're done") are forfeiting systematic improvement.
Why Documentation Prevents Accidental Regression
The most common mistake in iterative design is losing a working configuration. Imagine your team discovers a skirt geometry that produces excellent lift at low fan speed. In the next iteration, you change both the skirt geometry and the fan mounting angle. Performance drops. You're now unsure whether to revert the skirt, the mount, or both — and you no longer have a record of the exact original dimensions.
This is accidental regression: inadvertently moving backward while trying to move forward.
Prevention requires a design log: a written (or digital) record of every configuration tested. Each entry should capture:
- Configuration ID (e.g., "v3.2")
- What changed from the prior version (e.g., "Replaced fabric skirt with polythene, sealed with hot glue, 3 mm overlap at seams")
- **Test condi
9.2 Measuring Run Performance
Why Measurement Consistency Is Non-Negotiable
Data is only as good as the measurement process that produced it. In hovercraft testing, two teams might test the "same" vehicle configuration and record completely different run times — not because the vehicle behaved differently, but because one team eyeballed distances while the other used tape marks, or one timed from button press while the other timed from craft motion.
For data to drive useful design decisions, measurements must be consistent across all tests. This section establishes the standards and tools that make run performance data trustworthy.
Setting Up a Repeatable Test Track
The ideal test track mimics competition conditions as closely as possible. Key setup steps:
Surface: Use a hard, flat, clean surface. Gymnasium floors, smooth concrete, or polished tile are best. Carpet introduces variable drag depending on pile direction, humidity, and surface age — avoid it unless the competition venue is carpeted. Sweep the track before every session.
Distance markers: Place cones or tape marks at fixed intervals: for example, at 0.5 m, 1.0 m, 1.5 m, 2.0 m, 2.5 m, and 3.0 m from the launch line. The launch line itself must be a fixed physical reference (a strip of tape, not a person's foot).
Starting position: The front edge of the craft should be placed consistently at the launch line for every run. A small tape notch on the hull can help the operator align quickly without measuring each time.
Wind and doors: Close doors and windows to minimize ambient airflow. Even a gentle breeze (1–2 m/s) can add or subtract measurable time on a low-drag hovercraft. Record any unusual air conditions in the test log.
Measuring Distance
Distance measurement has two practical approaches:
- Final rest position: After the craft stops, measure from the launch line to the nearest edge of the craft. This method captures total run distance but is sensitiv
9.3 Controlled Variable Testing
The Principle of One-Variable Isolation
Controlled variable testing is the experimental analog of surgical precision: change one thing, measure the effect, then decide what to do next. This principle is foundational to all scientific inquiry, and it is just as essential in an engineering lab as in a chemistry experiment. For Science Olympiad hovercraft teams, it is the methodology that separates systematic improvement from random tinkering.
The formal framework is simple:
- Independent variable: The single element you deliberately change between tests.
- Dependent variable: The metric you measure to assess the effect (e.g., run time, lift-off time, drift angle).
- Controlled variables: Every other design parameter, test condition, and measurement method — held constant across the two tests you are comparing.
Violating the controlled-variable principle by changing two or more elements simultaneously means the test data cannot tell you which change caused the observed outcome. You might get lucky and improve performance, but you will not understand why, and you will not be able to reproduce or extend the improvement reliably.
Common Design Variables in Hovercraft Testing
Hovercraft design offers a rich space of testable independent variables. The following are the highest-leverage candidates for systematic experimentation:
Skirt type and geometry:
- Open plenum vs. segmented skirt vs. bag skirt
- Skirt attachment overlap (e.g., 5 mm vs. 10 mm)
- Number of segments in a segmented skirt
- Skirt material (polythene film vs. mylar vs. fabric)
Fan system:
- Fan speed setting (% throttle or discrete switch positions)
- Propeller pitch angle
- Number of lift fans vs. thrust fans
- Fan mounting angle relative to hull
Power system:
- Battery charge level at start of run (fully charged vs. 80% vs. 60%)
- Battery chemistry (NiMH vs. LiPo, if rules allow)
- Wire gauge and connector resistance (affects
9.4 Data Tables & Graphs
Data as the Engineer's Evidence Base
Engineers do not operate on intuition alone — they operate on evidence. In hovercraft design, the difference between a team that iterates intelligently and one that flails through dozens of changes without progress often comes down to whether they kept rigorous data and used graphs to understand their craft's behavior. Data tables and graphs are not administrative overhead; they are the primary tools for translating raw test results into actionable design insights.
Structuring a Run Data Table
A well-designed data table captures enough information to reconstruct the test conditions months later. The minimum recommended fields for a hovercraft run log are:
| Field | Purpose |
|---|---|
| Run ID | Unique identifier (e.g., "R047") |
| Date & Time | Allows correlation with battery logs, weather |
| Config Version | Which design iteration was under test |
| Surface | Floor type and cleanliness |
| Battery SoC (%) | Voltage before run |
| Fan Setting | Throttle % or switch position |
| Lift-Off Time T₁ (s) | Time from switch to levitation |
| Run Time T₂ (s) | Time from first translation to rest |
| Distance (cm) | Measured to nearest centimeter |
| Score | Calculated from scoring formula |
| Notes | Anomalies, observations, failures |
Avoiding the temptation to "remember" details from a run and write them down later — memory is unreliable and systematically optimistic. Record data immediately after each run.
Types of Graphs and What They Reveal
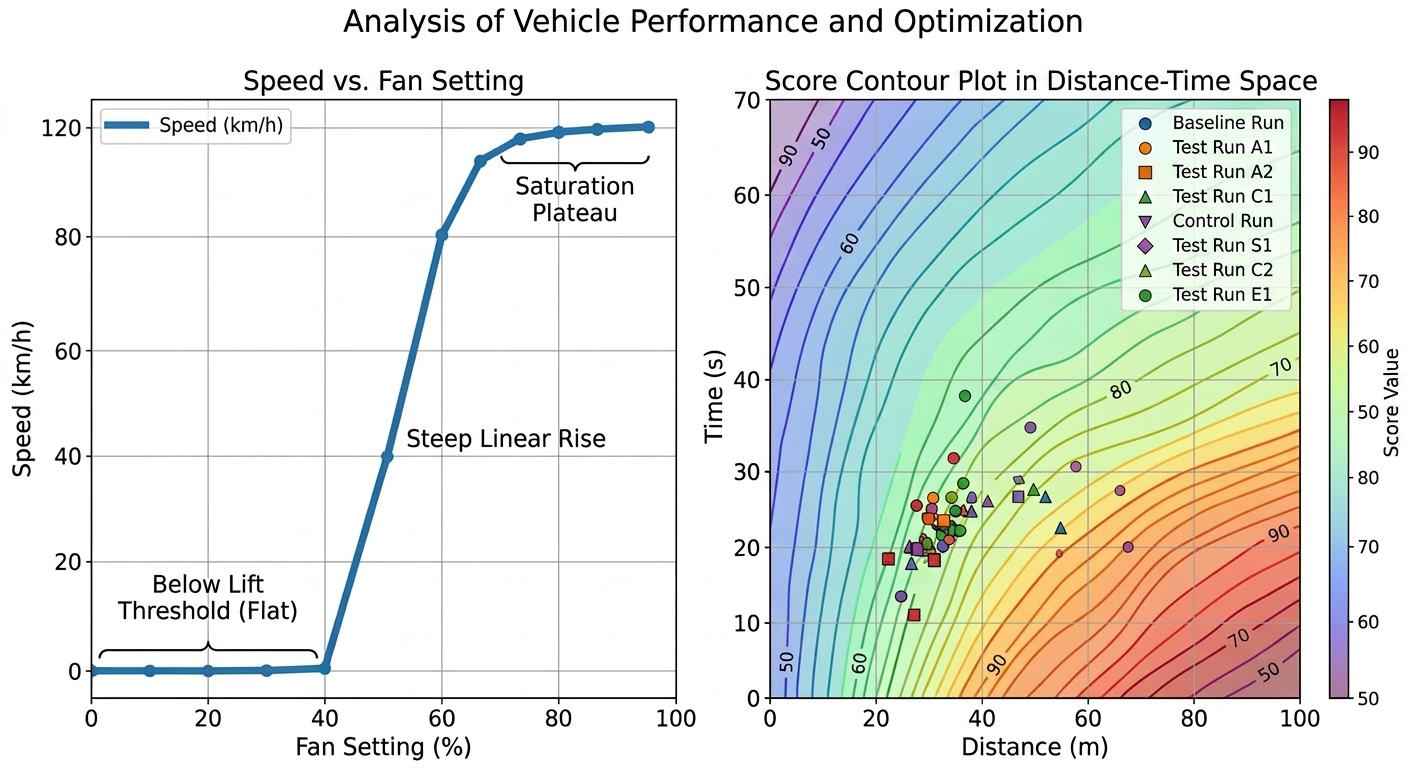
Raw tables are hard to interpret at a glance. Converting data to graphs reveals trends, nonlinearities, and anomalies that are invisible in rows of numbers.
Speed vs. Fan Setting Curve (Response Curve)
Plot average craft speed (total distance / run time, in cm/s) on the Y-axis against fan speed setting (% throttle) on the X-axis. This is the most informative single graph in hovercraft development. It reveals:
- The **onset thresh
9.5 Failure Mode Analysis
Engineering Risk Management at Competition Scale
In professional engineering, Failure Mode and Effects Analysis (FMEA) is a structured methodology for identifying all the ways a system can fail, ranking those failures by severity and likelihood, and then implementing mitigations before deployment. For Science Olympiad Hovercraft, a simplified FMEA gives Division C teams a powerful mental framework for anticipating problems before they occur on competition day — when there is no time to improvise.
The FMEA process asks three questions for each potential failure:
- What could go wrong? (Failure mode)
- How bad is it? (Severity: does it prevent scoring entirely, or only reduce score?)
- How likely is it? (Probability: has it happened before? Under what conditions?)
Risk Priority = Severity × Probability × Detectability. Failures that are severe, likely, and hard to detect before a run deserve the most mitigation investment.
Cataloging Hovercraft Failure Modes
The following are the most common failure categories observed in practice and competition:
1. Skirt Failure
- Modes: Tear at seam, delamination from hull, puncture from floor debris, fold-over during levitation causing air loss from one side.
- Symptoms: Craft tilts, fails to hover symmetrically, or drags on one edge.
- Severity: High — a major skirt tear often prevents hover entirely (score = 0 for that run).
- Likelihood: Medium-High — skirts are the most mechanically stressed component. Mylar and polythene are particularly vulnerable to crease-induced micro-tears at fold lines.
- Mitigation: Carry pre-cut replacement skirt material, tape, and glue at impound. Practice skirt replacement under 2-minute time pressure. Inspect seams with a flashlight at the start of the event window.
2. Insufficient Lift
- Modes: Fan speed set too low, battery depleted, plenum hole blocked by debris, skirt pinhole leak pattern.
- Symptoms: Craft m
9.6 Practice Runs & Repeatability
The Repeatability Principle in Engineering
In manufacturing and quality engineering, repeatability refers to the ability of a process to produce consistent results across successive trials under identical conditions. A CNC machine that mills a part to ±0.01 mm on the first run and ±0.05 mm on the second run has poor repeatability — and poor repeatability makes quality assurance impossible.
The same concept applies directly to Science Olympiad hovercraft. A craft that achieves an exceptional run once but cannot reproduce it is, from a competition-strategy standpoint, nearly worthless. Every run at competition is an independent event: you cannot bank the exceptional run and spend it later. What you earn is a distribution of scores across your actual competition attempts, and the expectation (in the statistical sense) of your final score depends on both your mean performance and your variance.
Quantifying Repeatability
Repeatability is formally quantified by the coefficient of variation (CV): the ratio of the standard deviation to the mean, expressed as a percentage.
CV = (σ / μ) × 100%
For a hovercraft design aiming for competition-level reliability, target CV < 10% for run time across at least 10 consecutive test runs under consistent conditions. A CV above 20% indicates the craft is unreliable — something in the design is sensitive to small perturbations (battery state, starting position, skirt orientation) in a way that should be addressed before competition.
Example: A craft's run times over 10 trials are: 3.8, 4.1, 3.7, 5.2, 3.9, 4.0, 3.8, 3.6, 5.0, 3.9 seconds.
- Mean: 3.9 + (one outlier treatment needed)
- The two outliers (5.0, 5.2) indicate occasional mode-switching failure — perhaps the skirt folds over under certain initial conditions, dramatically increasing friction.
- CV including outliers ≈ 16% — borderline. The root cause of the outliers should be investigated and eliminated.
Why Mod
…❓ Practice Questions
No practice questions linked to this module yet.
🎬 Study Videos
No videos linked to this module yet.
🔗 Resources
-
Official Science Olympiad event page for Hovercraft (Division C). Contains event description, links to official rules, recommended resources, and preparation guidance.
-
Full 2026 Hovercraft event rules including scoring formulas (TS, DS, BS), construction and competition violation penalties, tiebreaker criteria, and prohibited components.
-
Foundational curriculum guide explaining what a hovercraft is and the physics of air cushion lift. Free educational material from the international school hovercraft project — ideal for Module 2 grounding.
-
Explains how increasing air pressure under the hovercraft skirt generates the lift force that raises the vehicle off the ground. Covers the relationship between fan air volume and cushion pressure.
-
Quantitative treatment of hovercraft lift: lift force = cushion pressure × skirt enclosed area. Includes formulas for air gap clearance and pressure calculations relevant to Module 2 physics.
-
NASA's Beginner's Guide to Aeronautics covering all three of Newton's Laws with applications to thrust and drag. Essential physics background for understanding hovercraft propulsion and motion.